
· Series: Mapping Meaning · 23 min read
The Slide Said "Up 4%." Why Did It Look Like a Huge Increase?
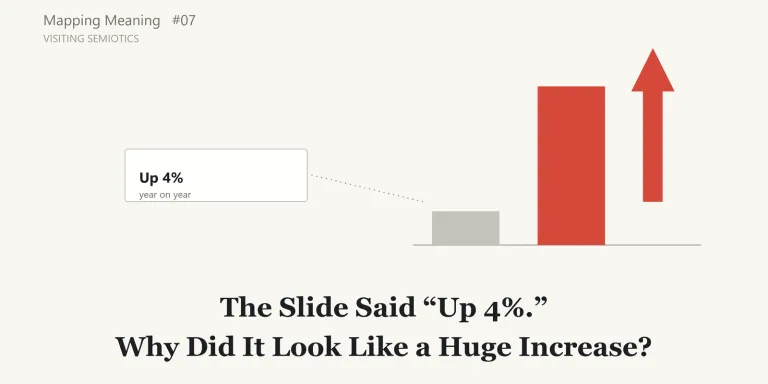
Mapping Meaning, Episode 7: Visiting Semiotics
The meeting left me with “a big increase”
At the monthly meeting, a slide on sales goes up on the screen.
The title is “Sales This Period.” In the middle are two bars, side by side: last year on the left, this year on the right. The right-hand bar is red, and a thick upward arrow sits on top of it. It looks about three times as tall as the left-hand bar.
Near the bottom of the slide, in small type, is this:
Up 4% year on year. Contribution from new customers unconfirmed.
After the meeting, someone in the corridor says, “Sales really grew a lot this period.” I had come away with the same impression.
When I looked at the slide again later, I noticed something. Nowhere on it does it say that sales grew a lot. The number it gives is 4%, and it even comes with a caveat: “unconfirmed.” Even so, most of the people in the room left with the impression of a big increase.
The vertical axis of the chart did not start at zero. It started a little below last year’s figure. So a difference of 4% looked, in the heights of the bars, like a difference of several times.
(This scene is a hypothetical example, made up to illustrate the question.)

Nobody wrote “a big increase”
In the last episode, visiting hermeneutics, I came to think that the reader, too, takes part in the coming about of meaning. Looking at documents again with that in mind, I noticed something else. I was not only reading words.
Up to now, this series has looked at language: the difference between what is written and what comes across (Episode 3), what comes across without being said (Episode 4), what is done by saying (Episode 5), and what happens when something is read across time (Episode 6).
But what carried “a big increase” in that meeting was not language alone. It was also the height of the bars, the red, the upward arrow, and the point where the vertical axis began.
How do a chart, a color, an arrow or a layout tell us something that no sentence on the slide says?
A field about signs
When I looked into it, I found a field that considers, not only words, but the whole business of something meaning something: semiotics.
The French Larousse encyclopedia’s entry “sémiotique” says that semiotics took shape mainly from the work of the American philosopher Charles S. Peirce and the Geneva linguist Ferdinand de Saussure. Saussure, the entry says, called the discipline sémiologie and defined it as “une science qui étudie la vie des signes au sein de la vie sociale” (a science that studies the life of signs within social life).
This time I came in from Peirce’s side. My way in was Albert Atkin’s entry “Peirce’s Theory of Signs” in the Stanford Encyclopedia of Philosophy (SEP). It opens by presenting Peirce’s sign theory as an account of signification, representation, reference and meaning, distinctive in part for “capturing the importance of interpretation to signification.”
On diagrams themselves, I also read the SEP entry “Diagrams and Diagrammatical Reasoning” by Sun-Joo Shin, Oliver Lemon and John Mumma. For the Japanese edition, I used two Japanese university bulletin papers to check translated terms. As before, I am recording what I could understand from what I read, not explaining the field as a specialist. I did not read Peirce’s or Saussure’s own writings.
A sign needs more than a sign and an object
The first thing that caught my attention in Peirce was that meaning holds among three things, not two.
We usually picture meaning as a relation between two things: a sign and what it stands for. Smoke, say, and the fire it points to.
According to Atkin’s entry, Peirce worked with three: the sign, the object it stands for, and a third element, the interpretant. The entry calls the interpretant “the most innovative and distinctive feature of Peirce’s account” and says it is “best thought of as the understanding that we have of the sign/object relation.” The importance of the interpretant, the entry continues, is that “signification is not a simple dyadic relationship between sign and object: a sign signifies only in being interpreted.” In this series’ plainer terms, a sign means something only when it is read.
That seems to echo the last episode, where the reader turned out to take part in meaning. But the entry does not describe the interpretant as the reader’s subjective impression. It says that, although it has characterized the interpretant as the understanding we reach of a sign/object relation, the interpretant “is perhaps more properly thought of as the translation or development of the original sign,” one that allows “a more complex understanding of the sign’s object.”
The entry also discusses Peirce’s claim that the object “determines” the sign. It says this notion “is by no means clear and it is open to interpretation,” but that it is perhaps best understood as “the placing of constraints or conditions on successful signification by the object,” rather than the object causing the sign.
The reader does not get to choose freely
Atkin’s entry makes this concrete with an example. A molehill in my lawn can be taken as a sign of moles. But not every feature of the molehill plays a part in signifying moles. Its color plays a secondary role, since that depends on the soil it is made of. Its size varies with the size of the mole. What is central is the connection between moles and the mound: moles make molehills. As the entry puts it, primary to the molehill’s ability to signify the mole is “the brute physical connection between it and a mole.”
What I took from this is that not every visible feature of a sign carries the same weight. A sign signifies only in being interpreted, but the reader is not free to make it mean anything at all. Which features of a sign carry its meaning is narrowed by the sign’s relation to its object.
That also qualifies what I took from the last episode. The reader takes part in meaning, but taking part is not the same as reading arbitrarily.
Resembling, connected, conventional
How, then, does a sign stand for its object? This is where Peirce’s best-known distinction comes in.
Putting the entry’s descriptions in my own words, there are three ways.
The first is meaning through resemblance. A portrait stands for the person it depicts by resembling them. Peirce called this kind of sign an icon.
The second is meaning through an actual connection. Smoke stands for fire, and a weathercock for the direction of the wind, because they are actually connected to what they stand for. A causal connection is one form that connection can take. Peirce called this kind of sign an index. The entry describes it as a sign interpreted “in virtue of some brute, existential fact, causal connections say.”
The third is meaning through convention or habit. The French “homme” and the English “man” stand for the same thing, not because they resemble anything or are physically connected to it, but because of an “observed general or conventional connection,” as the entry puts it: there is a rule or habit of using them that way. Peirce called this kind of sign a symbol. In another part of the entry, where signs are divided from a different angle, traffic lights and words are given as examples of signs that signify through “convention, habit or law.”
The categories do not stay in clean boxes
These three are not tidy boxes, though. According to Atkin’s entry, “by 1903 Peirce was aware that it would be hard, if not impossible, to find any pure instances of icons and indices.” He “began to suspect that icons and indices were always partly symbolic or conventional.” One of the Japanese papers I used, by Satoshi Nakagawa, goes further in its reading: Peirce seems to have thought that every sign has an iconic, an indexical and a symbolic character. So a single sign may work in more than one of these ways at once.
The entry also says that, by 1903, Peirce’s examples of icons included “diagrams used in geometrical reasoning.” Diagrams were already treated as signs that mean, at least in part, by resembling.
Diagrams can make conclusions visible
The SEP entry on diagrams discusses a well-known paper by Larkin and Simon, “Why a Diagram is Sometimes Worth Ten Thousand Words” (1987). As the entry summarizes it, Larkin and Simon distinguished two kinds of equivalence between representations. Two representations are informationally equivalent if they express the same content. They are computationally equivalent only if, in addition, the same inferences can be drawn from them “easily and quickly.” Comparing sentences and diagrams, Larkin and Simon argued that the two can be equivalent in information while differing in how easily useful conclusions can be drawn. In a diagram, some relationships are directly perceived that would take work to extract from sentences.
The entry quotes their discussion of the supply-and-demand graphs found in economics textbooks: “the great utility of the diagram arises from perceptual enhancement, the fact that it makes explicit the relative positions of the equilibrium points, so that the conclusion can be read off with the help of simple, direct perceptual operations.”
The entry presents this as a strength of diagrams. Back in the meeting room, the same point shows another face.
Fast reading is still inference
“Sales grew a lot” was not written anywhere as a sentence. The people in the room read it off the heights of the bars, almost instantly.
What this suggested to me is that the speed of the reading does not mean no inference took place. Fast inference is still inference. If anything, because the inference happens so quickly, it may be harder to notice that one has inferred anything at all.
This is where the visit overlaps with earlier episodes. “Sales grew a lot” is an inference the readers made, the kind of thing Episode 4 was about. But it was not made from nothing. It was guided by features on the artifact’s side: the bar heights, the axis, the color, the arrow.
What diagrams can leave out
The same entry also discusses limits of diagrams. In Euler diagrams, which represent relations between sets with overlapping circles, the constraints of drawing can force the user, in some cases, “to represent a relationship between the sets which is not logically necessary.” The entry says that a user “would make incorrect inferences if they relied on the system for reasoning.” Later, in a discussion of the idea that contradictions and tautologies are not part of the world, it asks how one could draw a picture of “the disjunctive information ‘it is either raining or not raining’.”
These are discussions of logical diagrams, not of sales charts. And the same entry also reports results that “refuted a widely-held assumption that diagrams are inherently misleading.” So I cannot carry these points over as a claim about charts.
They did leave me with a question, though. In prose, one can write “perhaps,” “may,” or “unconfirmed.” Can a chart keep that kind of qualification just as visibly? This made me wonder whether visual representations can sometimes lose qualifications that prose keeps explicit. On the meeting slide, “Contribution from new customers unconfirmed” appeared only in the small type. The red bar and the arrow did not visibly carry it.
I do not want to say that the picture contradicted the text. The text said 4%, and the bars did show an increase. The question is a different one: did the visual presentation carry a stronger meaning than the text?
Looking at the sales chart again
Here I want to look at the meeting slide again, borrowing Peirce’s three distinctions. What follows is not semiotics itself. It is my own sorting, using a viewpoint borrowed from it. I am not claiming that Peirce would classify these features this way.
First, the heights of the bars can be read as meaning by resemblance. The chart is read on the understanding that the ratio of the bar heights resembles the ratio of the sales figures. But when the vertical axis does not start at zero, the resemblance between the bar-height ratio and the numerical ratio breaks down. The sales ratio is 1.04. The bars look as if the ratio were about three.
Second, the chart as a whole can be read as meaning by connection. The people looking at it assume it was made from the actual sales records: if the records changed, the bars would change too. But that connection is not visible on the slide. The slide did not say which records the chart was made from, or as of what date the figures were taken, or how the records were turned into bars.
Third, the red and the upward arrow can be read as meaning by convention. In that meeting, the upward arrow seems to have been read as something going up, and perhaps as something good, and the red as emphasis. But there may be workplaces where red means caution, or a loss. Whose convention is this? The company’s, the industry’s, a culture’s, a design system’s? On the slide, there was no way to tell.
Sorted this way, what I had been calling, in one phrase, “the chart says more than the text” splits into three separate questions. Has the resemblance been distorted? Can the connection to the records be checked? Is the convention shared? The three can fail in different places. “The chart says more than the text” was too coarse a question.

The meaning “a big increase” was completed, in the end, by the reading of the people in the room. But that reading was strongly guided by features on the sign’s side: where the axis started, and how tall the bars were.
An older definition of pragmatics
In Episode 3, I left a question open: how far does the name of Meaning Audit’s Context / Pragmatics stage overlap with pragmatics as an academic field? In particular, how does pragmatics treat meaning carried by figures and layout? As in earlier episodes, I write the Meaning Audit stage names in capitals and the field in lowercase.
The SEP entry “Pragmatics,” by Kepa Korta and John Perry, lists several definitions of pragmatics. The first is Charles Morris’s, from 1938. Semantics deals with the relation of signs to the objects they may or do denote, and “Pragmatics concerns the relation of signs to their interpreters.” The Larousse entry also says that Morris divided semiotics into three branches: pragmatics, syntax and semantics.
So, at least on Morris’s definition, pragmatics was defined in terms of signs in general and those who interpret them, not only spoken utterances. That at least leaves room for figures and layout to fall within its scope as signs.
That is a point about one historical definition. I did not check how far current research in pragmatics deals with figures or layout. The same section of the entry also gives Carnap’s definition, which centers on the speaker, or more generally the user of a language, and others besides; there was no single definition. For the question I left in Episode 3, I found a partial clue, not an answer.
What this adds to Meaning Audit
What follows is my own reflection, not something the sources say.
First, at this point in the project, Meaning Audit already treated figures as things to audit. In the version of Meaning Audit I was using then, the units of an audit included figures and graphs. At the Context / Pragmatics stage, the method checked whether figures, graphs, color, size or placement were claiming more than the text. And where a figure or layout claimed more than the text or the source, it was recorded as a finding of a type called VISUAL_CLAIM. The meeting slide would have been caught from that angle.
So semiotics did not bring a new object into Meaning Audit. What it seems to offer is a way of splitting one of the method’s existing questions, “is this figure claiming more than the text?”, more finely. One possible way of placing the three borrowed questions would be this: which records the chart is connected to could be checked at Evidence / Source; whose convention the color and arrow follow, at Interpretation; and whether the resemblance has been distorted (where the axis starts, areas, scale), at Context / Pragmatics. In the version I was using then, color and placement were themselves listed under Context / Pragmatics, so this is a possibility, not a rewritten stage specification.
Second, there is the conclusion a chart lets readers draw. In the version I was using then, Meaning Audit looked at the step from grounds to conclusion at the Inference / Warrant stage. A chart lets a conclusion be read without ever being written as a sentence. One step that might help in an audit is to write that conclusion out as a sentence, “Sales grew dramatically,” and then ask whether the evidence actually supports it.
What happened to the caveat?
Third, there is the caveat. If the text says “unconfirmed” or “possible,” is the chart presenting the same thing without qualification? In the version I was using then, the Commitment stage checked whether certainty, scope or strength was presented as stronger than the grounds supported, and recorded such cases as AMPLIFICATION. The meeting slide raises the same kind of question: is the artifact, through a strong red, an upward arrow and an enlarged visual difference, carrying a level of certainty or strength that its evidence, including its own caveat, does not support? This seems to overlap with AMPLIFICATION.
Semiotics and Meaning Audit are not doing the same thing, though. Semiotics, as I met it here, asks what it is for a sign to mean something; Atkin’s entry says Peirce treated sign theory as central to his work on logic and as the medium for inquiry. Meaning Audit is a method for tracing where meaning moved in an artifact, beyond or away from its support. Peirce’s distinctions are for thinking about the ways signs signify. They are not criteria for deciding whether a chart is misleading. Atkin’s entry also says that much of Peirce’s final account of signs “is still unclear, unsatisfactory, incomplete, and controversial.” I cannot carry the classification over as an audit classification, and I am not trying to.
What is an AI-generated chart connected to?
One last question I want to leave here.
People now often ask AI to summarize material or to build slides, and AI can draw convincing charts.
Borrowing Peirce’s distinctions, a question comes up. A chart made from actual data, with a spreadsheet or a visualization tool, can preserve a path back to the data it was made from if the source data and the transformation are retained, even if AI helped with the work. The question is not whether AI was used. It is whether the provenance, the underlying data and the transformation can be traced. But what about a chart whose generation process and underlying data are not visible? It looks like a chart. If I cannot trace what records generated it, what exactly is it connected to? Looking like a chart and being connected to records should be two different things.
In the version of Meaning Audit I was using then, the stated limitations already included that AI might not read figures, images, graphs or layouts correctly. That is a different question. Whether AI can read a chart correctly is one question. What a chart produced by AI is connected to is another.
The SEP entry on diagrams does mention computer programs that work with diagrams, for example in teaching logic and in automated theorem proving. But in the sources I read, I found no discussion of AI-generated charts, or of what such charts are connected to. I leave this as UNKNOWN.
A map from Episode 7
As in earlier episodes, the left side shows Meaning Audit’s stages, and the right side shows questions raised by this visit. The ideas of semiotics are not inserted into Meaning Audit’s stages. This time the questions gathered at Interpretation and Context / Pragmatics, with further questions at Evidence / Source and Commitment.

Note: the questions on the right are not a formal model from semiotics. They are questions I picked up from what I read. Their placement against the stages is one possible arrangement, not the method’s specification.
What I learned
- Using Peirce’s distinctions as a borrowed lens, I found that the single question “is the chart saying more than the text?” could be split three ways: what does it mean by resemblance, what by connection, and what by convention? The three can fail in different places. This is my own application, not a Peircean classification of charts or a Meaning Audit specification.
- On Atkin’s account, Peirce held that a sign signifies only in being interpreted. But, as I read the entry, the reader does not decide its meaning freely: the sign’s relation to its object narrows which features carry meaning. This let me think a little more precisely about the last episode’s point that the reader takes part in meaning.
- A chart lets a conclusion be read without being written as a sentence. Reading it quickly does not mean no inference took place.
- Whether a chart can keep a qualification such as “may” or “unconfirmed” as visibly as prose can is a question I picked up from a discussion of logical diagrams; I have not checked it. Whether a caveat in the text has disappeared in the chart seems worth checking.
- At least on Morris’s definition, pragmatics was defined in terms of signs in general and their interpreters.
What remains open
- How far does current research in pragmatics deal with figures, layout and color? What I could confirm went only as far as Morris’s definition.
- Whose convention is the “rule” for colors and arrows? When it differs by company, industry or culture, which convention should a Meaning Audit take as its standard? This is the same shape of question as last episode’s “Which context are we auditing?”
- When a chart and the text say different things, which one tells us what the artifact has committed to?
- Can a chart whose generation process and underlying data are not visible be said to be connected to data? The sources I read did not discuss this.
- From an annotated summary on a university course page (listed in the sources), I learned that Roland Barthes, in “Rhetoric of the Image” (1964), discussed how words accompanying an image can steer the reader toward a meaning chosen in advance, which the summary calls “anchorage.” I checked only the opening page of the original and could not read the relevant passage. I also learned that there is a field called organizational semiotics, which deals with signs in organizations, but I did not read into it for this episode.
Next
This time I looked at the meeting chart again by splitting it three ways: resembling, connected, conventional. One of those, connection, was the question of whether the chart was made from the actual records.
But suppose the chart really is connected to the records, and the axis starts at zero. The number still says “up 4%.” How far does a record of “up 4% year on year” support the conclusion that sales have recovered? Is one year’s difference a chance fluctuation, or evidence that something has changed?
What is required between data and a conclusion? Next, I will take that question to the philosophy of science.
Sources
- Atkin, A., “Peirce’s Theory of Signs,” Stanford Encyclopedia of Philosophy (first published 2006-10-13; substantive revision 2022-08-04). https://plato.stanford.edu/entries/peirce-semiotics/
- Shin, S.-J., Lemon, O. & Mumma, J., “Diagrams and Diagrammatical Reasoning,” Stanford Encyclopedia of Philosophy (first published 2001-08-28; substantive revision 2025-09-15). https://plato.stanford.edu/entries/diagrams/
- Korta, K. & Perry, J., “Pragmatics,” Stanford Encyclopedia of Philosophy (first published 2006-11-28; substantive revision 2024-05-28), §5 “Some Definitions of Pragmatics.” https://plato.stanford.edu/entries/pragmatics/
- Larousse, Encyclopédie, « sémiotique ». https://www.larousse.fr/encyclopedie/divers/s%C3%A9miotique/91160 (accessed 2026-10-09 for the Japanese edition; rechecked 2026-10-21)
- 中川敏「類像性の論理:模型の人類学(その2)」『大阪大学大学院人間科学研究科紀要』第45号, 2019, pp. 163–175 (Japanese). https://doi.org/10.18910/71839
- 大橋昭一「『組織記号論』と『批判的記号論』―最近における記号論拡大の2つの方向―」『関西大学商学論集』第62巻第4号, 2018 (Japanese). https://kansai-u.repo.nii.ac.jp/record/9320/files/KU-1100-20180310-08.pdf
- Dickinson, L., abstract of Barthes, “Rhetoric of the Image,” from M. Hancher’s Electronic Text: Selective Annotated Bibliography (University of Minnesota), on a Universitat de València course page. https://www.uv.es/~fores/programa/barthes_rhetoricimage.html (used only for the summary of “anchorage”)
Peirce’s papers and manuscripts, Saussure’s Course in General Linguistics, Morris’s Foundations of the Theory of Signs (1938), and Larkin and Simon’s paper (1987) were not read for this episode. Peirce’s, Morris’s, and Larkin and Simon’s words are as quoted or reported in the SEP entries; Saussure’s definition is as quoted in the Larousse entry. Of Barthes’s “Rhétorique de l’image” (Communications 4, 1964; https://doi.org/10.3406/comm.1964.1027), only the opening page was checked; what the article says about anchorage comes from the course-page summary above.
The Japanese original of this article: 「4%増」と書いてあったのに、なぜ「大きく伸びた」と思ったのか