
· Series: Mapping Meaning · 23 min read
Sales Were Up 4%. Can I Say They've Recovered?
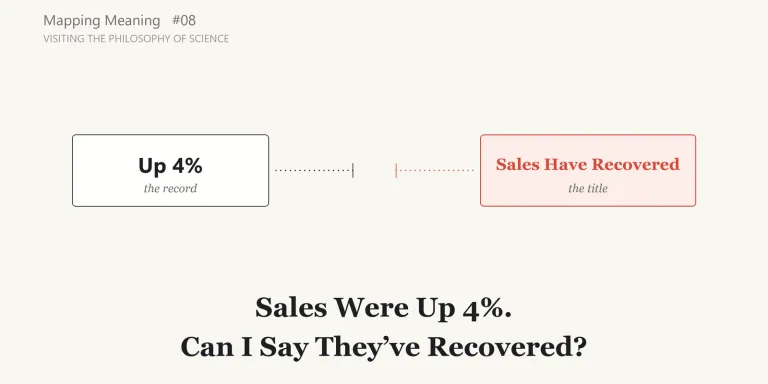
Mapping Meaning, Episode 8: Visiting the Philosophy of Science
The following month’s meeting
At the following month’s meeting, the sales slide goes up on the screen again.
This time the vertical axis starts at zero. Last year’s bar and this year’s bar stand side by side at almost the same height. There is no red and no arrow. Under the bars is the same figure as before:
Up 4% year on year.
The figure matches the records. The chart is connected to those records, and the bar heights resemble the numbers. The three things I checked last time, visiting semiotics, all seem to be in order.
But the title of the slide has changed:
Sales Have Recovered.
When I read it, something caught again. The chart is no longer saying more than the numbers. The title may be.
(As in the last episode, this scene is a hypothetical example, made up to illustrate the question.)
The record is right. What about the conclusion?
At the end of the last episode, I left a question. Suppose the chart really is connected to the records, and the axis starts at zero. How far does a record of “up 4% year on year” support the conclusion that sales have recovered?
When I think about it, more than one story fits a 4% increase.
Perhaps the business really has picked up. Perhaps last year happened to be unusually weak, and this year is simply back to normal. Perhaps prices went up, so revenue rose while the number of units sold actually fell. Perhaps a single large customer placed one big order. And the note from last month’s slide, “Contribution from new customers unconfirmed,” has still not been checked.
I am not saying these are equally likely. What I can say is that each of them is compatible with the record as presented. None of them contradicts “up 4% year on year.”

A record can be right without, by itself, being enough to support the conclusion drawn from it. The question is not only whether there is support, but how much support is enough for a conclusion stated this strongly. What is added between the data and the conclusion?
A field between evidence and hypothesis
This is also a question I had been putting off since Episode 1. There, looking at an AI’s answer of “15%,” I wrote that there is a field that studies how evidence supports a hypothesis, and that I wanted to come back to the question there. One place I found that question studied was the philosophy of science.
The philosophy of science covers a great deal. This time I visited only the part of it that deals with the relation between evidence and hypotheses, theories or conclusions.
My way in was Vincenzo Crupi’s entry “Confirmation” in the Stanford Encyclopedia of Philosophy (SEP). It opens by saying that human cognition and behavior heavily rely on the idea that “evidence (data, premises) can affect the credibility of hypotheses (theories, conclusions).” It then adds: “even with extensive and truthful evidence available, drawing a mistaken conclusion is more than a mere possibility.” The entry describes confirmation theory, roughly, as the area that has tried to define plausible models of non-deductive reasoning: support that falls short of logical entailment. A 4% increase does not logically entail a recovery.
I also read three other SEP entries: Kyle Stanford’s “Underdetermination of Scientific Theory,” Nora Mills Boyd and James Bogen’s “Theory and Observation in Science,” and Igor Douven’s “Abduction.” For the Japanese edition, I used two papers from the journal of the Philosophy of Science Society, Japan to check translated terms. As before, I am recording what I could understand from what I read, not explaining the field as a specialist. Several people are named below: Hume, Duhem, Mill, Bogen and Woodward, Carnap, Salmon and van Fraassen. I did not read any of their original works. What I say about them is what the SEP entries quote or report.
The record and what the record shows are not the same thing
The first thing that helped was a distinction between data and phenomena. According to “Theory and Observation in Science,” Bogen and Woodward argued, in a 1988 paper, that investigators do not test theoretical claims by comparing them directly with the data they collect. Instead, they “use data to infer facts about phenomena,” that is, events, regularities or processes regular enough to be predicted and explained systematically. In the entry’s example, the fact that lead melts at or close to 327.5°C is a phenomenon; an individual temperature reading is a piece of data.
The entry goes on to say that, as Bogen and Woodward argued, “there is often a long road between obtaining a particular dataset replete with idiosyncrasies born of unspecified causal nuances to any claim about the phenomenon ultimately of interest to the researchers.” Investigators, it says, “must distinguish features of the data that are indicative of facts about the phenomenon of interest from those which can safely be ignored, and those which must be corrected for.”
A business report is not a scientific experiment, and “up 4%” is not raw data in the scientific sense: someone has already chosen two periods, compared their revenue and calculated the ratio. Still, for this example, I can treat “up 4%” as being on the data side of the distinction. “Sales have recovered” is closer to a claim about what is happening in the business. Between the two, someone would have had to sort out what merely happened to be different this year from last.
So the distinction gave me a borrowed way of seeing the slide: there may also be a road between a sales record and the state of sales the slide says it shows.
The same evidence can fit more than one story
Next I read about underdetermination. Stanford’s entry puts the core of it as the simple idea that “the evidence available to us at a given time may be insufficient to determine what beliefs we should hold in response to it.” One familiar example in the entry is the adage that correlation does not imply causation. A correlation between time spent playing violent video games and aggressive behavior in the playground is what we would expect if the games caused the aggression, but also if aggressive children sought out such games, or if something else produced both.
The entry calls one division perhaps the most important: between two forms. In holist underdetermination, because hypotheses have empirical consequences “only when conjoined with other hypotheses and/or background beliefs about the world,” a failed prediction leaves open what to give up. In contrastive underdetermination, “for any body of evidence confirming a theory, there might well be other theories that are also well confirmed by that very same body of evidence.”
For the contrastive form, Stanford’s entry quotes John Stuart Mill. In short: a hypothesis should not be accepted as probably true merely because it accounts for all the known phenomena, since two conflicting hypotheses sometimes meet that condition tolerably well, and there may be “a thousand more which are equally possible” that our minds are “unfitted to conceive.”
A 4% increase fits “recovered.” It also fits “last year was weak,” “prices went up,” and “one large customer.” Underdetermination has been discussed mainly in connection with choosing between scientific theories, and I am not claiming the meeting slide is formally a case of it. But it looked structurally similar to me.
The point about alternatives nobody conceived also stays with me. When I try to think of other explanations, the ones I fail to imagine remain a problem. That does not mean no conclusion can ever be accepted. It is a limitation I cannot remove by trying harder, and I leave it open.
What if I choose the best explanation?
Then why not choose, from the candidates, the one that best explains the record?
Douven’s entry says that abduction, in the sense most used in the modern literature, is “also often called ‘Inference to the Best Explanation.’” Most philosophers, it says, agree that some form of it is frequently used, in everyday and in scientific reasoning. “However, the exact form as well as the normative status of abduction are still matters of controversy.”
The entry also presents an objection from van Fraassen. The best explanation is only the best of the candidates we came up with. Unless the absolutely best explanation is typically among them, the inference “may well lead us to believe ‘the best of a bad lot.’” The entry explains that the trouble lies especially in moving from a comparative premise, that this hypothesis is the best of the ones available, to an absolute conclusion, that it is true.
So I am not saying that choosing the best available explanation is always a mistake. The point is narrower: the best candidate we considered may still be the best of a bad lot.
Whoever wrote “Sales Have Recovered” may well have compared other explanations before choosing that one. But the slide does not show which candidates were compared.
A hypothesis is not tested alone
Stanford’s entry also discusses Duhem, and that argument stayed with me too. As the entry presents it, Duhem argued that a single scientific hypothesis does not by itself say what we should expect to observe. We can derive predictions from it only when it is combined with many other beliefs and hypotheses, “including background assumptions about the world, beliefs about how measuring instruments operate,” and so on. So when a prediction fails, the evidence tells us that something in that bundle is wrong, but not which part.
The reading “up 4%, so sales have recovered” seems to rely on several unstated assumptions as well. That the way sales are recorded is the same as last year. That returns and discounts are handled as they were. That the periods being compared are comparable. If any of these changed, the same 4% could mean something different.
The meeting slide is not a failed prediction, and Duhem’s argument, as the entry presents it, is about what a failed prediction can tell us. What I borrow from it is only this: the bridge from evidence to a conclusion may contain a bundle of assumptions, not a single reason.
“Supports” can mean two different things
What helped most this time was a distinction in Crupi’s entry.
We often say, casually, that the data “support” a conclusion. That word can mean at least two things. One is that the evidence makes the hypothesis more credible than it was. The other is how credible the hypothesis is once the evidence has been taken into account. The entry calls the first confirmation as relevance and the second confirmation as firmness; “firmness,” it notes, is Carnap’s term.
In plain terms, relevance asks: did this evidence make the hypothesis more credible than it was before? Firmness asks: once the evidence is taken into account, how credible is the hypothesis?
The entry adds that, as it formulates confirmation, the relation always holds relative to something further: auxiliary assumptions and other background information. The same evidence may support a hypothesis differently depending on what is already assumed or known.
Up is not the same as high
The two senses come apart. The entry’s example is a very rare disease. A positive test result raises the probability that a person has the disease, so in the relevance sense the result confirms the hypothesis that they have it. But because the disease is so rare, the probability “can be quite low even after a relevant positive test result.”
The evidence raised the probability is not the same as the probability is now high.

The entry quotes Salmon calling the distinction “extremely fundamental” and yet “sometimes unnoticed,” and says it has had to be stressed time and again, in philosophy and in other fields, including artificial intelligence and the psychology of reasoning.
Looking at the slide again
Here I want to look at the following month’s slide again, using the views I borrowed. What follows is my application of borrowed distinctions, not the philosophy of science itself.
First, “up 4%” is on the data side, and “recovered” is closer to a claim about what is happening in the business. The road between them is not on the slide.
Second, other explanations besides “recovered” fit a 4% increase. The slide puts only one of them in the title. Whether other candidates were compared, the slide does not say.
Third, reading the slide as “recovered” needs assumptions: the same way of recording sales, comparable periods, and so on. These are not on the slide either.
Fourth, there is the strength of the support. A 4% increase may make “recovered” somewhat more credible. Whether it makes it credible enough to say “Sales Have Recovered” is a separate question. “There are signs of recovery” and “Sales have recovered” ask for different strengths of support from the same data. I do not mean that one sentence corresponds exactly to relevance and the other to firmness; the two senses only helped me notice the difference.
Sorted this way, the question turned up in a different place from last time. In the last episode, the question was whether the chart said more than the text. This time it is whether the words say more than the data.
What this adds to Meaning Audit
What follows is my own reflection, not something the sources say. As in earlier episodes, I write Meaning Audit’s stage names in capitals, such as Inference / Warrant and Commitment. The same words in lowercase, such as evidence or warrant, are ordinary or academic uses, and the capitals do not claim that the concepts are the same or different.
Meaning Audit is a method for tracing where, between the grounds and the meaning an artifact presents, meaning was added, changed or taken on. Visiting the philosophy of science, I found four questions about that “between” that I want to take back.
Between Evidence / Source and Interpretation
The first is the road from data to what the data show. Before moving from grounds to a conclusion, there is a step from a record to what the record is taken to show. Between “up 4% year on year” and “recovered,” someone would have had to sort out what merely happened to differ between the two years. An audit could ask whether that step is written anywhere in the artifact.
At this point in the project, the method did not name this step on its own. I am not proposing a new stage for it. I am leaving it as a research question: should an audit make the step from a record to “what the record shows” more explicit?
What else fits the same evidence?
The second is other explanations that fit the same grounds. Instead of looking only at the one conclusion an artifact presents, an audit could ask: what other explanations are consistent with the same Evidence / Source? Were any compared? If so, which ones?
How many alternatives are enough is something I do not know. And as the “bad lot” worry suggests, the candidates an auditor thinks of may share the same limit.
The bridge may be a bundle
The third is the bundle of assumptions. In the version of Meaning Audit I was using then, the Inference / Warrant stage already asked whether there were unstated premises between the grounds and the conclusion, and any Warrant the auditor supplied was to be marked INFERRED rather than treated as fact. What this visit added was the thought that the reason connecting grounds and conclusion may not be a single sentence. It may be a bundle of assumptions: in the meeting example, how sales are recorded, which periods are compared, how returns and discounts are handled. When an auditor supplies a Warrant, one supplied reason may not be enough.
I am not saying that Duhem’s auxiliary assumptions are what Meaning Audit calls a Warrant, or that the confirmation relation is. I borrowed a picture of a bundle, not a definition.
How strong is “supports”?
The fourth is the strength of support. Evidence that makes a hypothesis more credible does not by itself settle whether an artifact is warranted in stating it outright. In the version of Meaning Audit I was using then, the Commitment stage already checked whether the strength with which an artifact adopted a meaning, as an assertion, a recommendation, a possibility or a qualified claim, matched the state of its grounds. Reading Crupi’s entry gave me a finer way to ask that question. When a slide says “the data support a recovery,” which sense of “support” is meant? And, as a separate question, is the evidence enough for the slide to adopt the conclusion as strongly as “Sales Have Recovered” does?
Confirmation as relevance or as firmness is not the same thing as Commitment, and I am not proposing a probability threshold for how strongly an artifact may state something. The distinction helped me ask the Commitment question more precisely; it does not answer it.
Some of these questions were already partly present in the method: unstated premises at Inference / Warrant, and strength measured against grounds at Commitment. Others, such as the step from data to what the data show, and the comparison of alternatives, were not reflected in it yet. Philosophy of science did not create the method’s Inference / Warrant stage; the stage was there before this visit.
Philosophy of science and Meaning Audit are not doing the same thing. Confirmation theory asks how evidence supports hypotheses, often using formal or probabilistic models. Meaning Audit traces where meaning moves in an artifact and does not calculate the probability of hypotheses. Crupi’s entry sets out several measures of confirmation, and I could not read it as showing agreement on which is right. In Douven’s entry, the normative status of inference to the best explanation is still treated as controversial. Philosophy of science gives me no ground for claiming that Meaning Audit is right, and I am not trying to.
What happened to Episode 1’s “15%”?
In Episode 1, I started from an AI answering, “There is a 15% chance that she likes him,” and left a question: under what conditions can a value given as a probability be said to be known?
In the probabilistic approaches discussed in Crupi’s entry, the probability of a hypothesis after the evidence is taken into account is a central tool. In words, that sounds close to the AI’s “15%.” From the sentence, I can tell the natural-language proposition the 15% refers to: that she likes him. What I cannot tell from the output alone is what evidence, what background assumptions, or what interpretation of probability makes it 15%, or what reasoning or model produced it. Whether it is the same kind of thing as the probabilities discussed in Crupi’s entry, I could not judge from what I read.
Crupi’s entry does mention artificial intelligence, as one of the fields where the distinction between firmness and relevance had to be stressed. But I found no discussion, in the entries I read, of probability values output by AI systems, or of whether such values are probabilities of hypotheses in the sense used in confirmation theory. I leave this as UNKNOWN.
A map from Episode 8
As in earlier episodes, the left side shows Meaning Audit’s stages, and the right side shows questions raised by this visit. The ideas of the philosophy of science are not inserted into Meaning Audit’s stages. This time the questions gathered at Inference / Warrant and Commitment, and a question was added between Evidence / Source and Interpretation: the step from data to what the data show.

Note: the questions on the right are not a formal model from the philosophy of science, and they are not a rewritten Meaning Audit specification. They are questions I picked up from what I read.
What I learned
- Using views borrowed from the philosophy of science, I found at least three places in the “between” of grounds and conclusion: the step from a record to what the record shows, the comparison of other explanations that fit the same record, and unstated assumptions.
- A record can be right without, by itself, being enough to support the conclusion drawn from it. The same record can fit more than one explanation.
- There is an objection that the best explanation is only the best of the candidates we came up with. If the compared candidates are not visible, how carefully the conclusion was chosen is not visible either.
- “Supports” can mean making a hypothesis more credible, or how credible it is once the evidence is in. Keeping the two apart helped me ask more precisely how strongly a conclusion drawn from the same data should be stated.
- This visit’s question sat in a different place from Episode 7’s question about charts. Words, too, can say more than the data.
What remains open
- How far can ideas such as confirmation and underdetermination, developed for science, be applied to a sentence in a meeting slide or a report? The scale and the purpose differ.
- In an audit, how many alternative explanations are enough? The candidates that no one thought of are also unthought of by the auditor. The “best of a bad lot” worry may apply to the auditor, too.
- Can the strength of support be recorded without using numbers?
- Is a probability output by an AI the same thing as the probability of a hypothesis after the evidence, in the sense used in confirmation theory? I found no discussion of probabilities output by AI in the sources I read.
- How much of the reasoning that connects grounds and conclusion should be written into an artifact? This time I got only as far as seeing that it may be a bundle rather than a single reason.
After eight visits
In Episode 0, I set out a plan to visit eight fields, one at a time, in a first phase. With the philosophy of science, those eight visits are complete. In the Japanese series, this was the point at which the first phase closed; this English edition has now retraced the same path.
Episode 0 also said this: I did not build Meaning Audit after studying these fields. I built it from discomfort I kept feeling in practical work, and only later, looking around, found academic fields nearby. And these fields are not the materials Meaning Audit was made from.
After eight visits, that order has not changed. The eight fields did not become parts of Meaning Audit. I went to each field with a question and borrowed ways of seeing that made my own questions finer. Where I could not borrow, or where Meaning Audit differs from the field, I wrote that down each time.
The visits did not complete Meaning Audit, either. If anything, the questions multiplied. Some of the questions I already had can now be split more finely. Others I had not thought of before the visits: the reader’s own prejudices, the three ways a chart can mean, the two senses of “supports.” And every episode ended with something still unknown.
The “map from Meaning Audit” at the end of each episode now numbers eight. They are not maps of a finished theory. But compared with the time of Episode 0, it is a little clearer which stages questions gather around, and where gaps remain.
In Episode 0, I also hoped that after eight visits the markings might add up to a single map. The eight maps have not been merged. I may turn to that, and to argumentation theory, which Episode 0 named as a candidate for a later phase. But I have not decided. I am also leaving open the question this episode ended on, how much of the reasoning that connects grounds and conclusion should be written down, and whether Meaning Audit’s Warrant is the same concept as warrant in argumentation theory. That remains UNKNOWN.
For now, the first phase closes here.
Sources
- Crupi, V., “Confirmation,” Stanford Encyclopedia of Philosophy (first published 2013-05-30; substantive revision 2025-08-04). https://plato.stanford.edu/entries/confirmation/
- Stanford, K., “Underdetermination of Scientific Theory,” Stanford Encyclopedia of Philosophy (first published 2009-08-12; substantive revision 2023-04-04). https://plato.stanford.edu/entries/scientific-underdetermination/
- Boyd, N. M. & Bogen, J., “Theory and Observation in Science,” Stanford Encyclopedia of Philosophy (first published 2009-01-06; substantive revision 2026-01-12), §2.3 “Data and phenomena.” https://plato.stanford.edu/entries/science-theory-observation/
- Douven, I., “Abduction,” Stanford Encyclopedia of Philosophy (first published 2011-03-09; substantive revision 2025-06-18). https://plato.stanford.edu/entries/abduction/
- 伊勢田哲治「応用科学哲学の問題としてのリスク」『科学哲学』第38巻第2号, 2005 (Japanese; used for translated terms). https://www.jstage.jst.go.jp/article/jpssj1968/38/2/38_2_77/_article/-char/ja
- 小川亮「哲学の一般的方法としての『最良の説明への推論』」『科学哲学』第55巻第1号, 2022 (Japanese; used for translated terms). https://www.jstage.jst.go.jp/article/jpssj/55/1/55_1-1/_article/-char/ja
The original works of Hume, Duhem (The Aim and Structure of Physical Theory), Mill (A System of Logic), Bogen and Woodward (1988), Carnap, Salmon (1969) and van Fraassen (1989) were not read for this episode. What this article says about them is as quoted or reported in the SEP entries.
The Japanese original of this article: 「前年比4%増」だから「回復した」と言えるのか